|

Definition of House Price Index (HPI)
A House Price Index (HPI) is defined as the measure of inflation (or deflation) of the price of houses over a certain period of time. The index describes the change in prices between base and specific time periods, allowing comparisons to be made of price movements between time periods relevant to geographical regions. The methodologies used depend on many factors such as the intended use of the index and the credibility of the data employed.
HPIs have an important role in the economy of every developed country. They provide a key factor in the decision making process for property owners, developers, contractors, real estate investors, real estate agents, government authorities, market analysts, suppliers and manufacturers of building products, insurance companies, public and private agencies involved in mortgage and housing loan providers and local municipalities.
HPIs Around the Globe
Some indices cover only narrow market segments. For example, house price measures for many central and Eastern European countries refer only to new houses in a selection of cities, the price behavior for which differs from that of existing homes. Australia measures only prices for major cities and Japan has no house price data at all. Eurostat and member governments have been trying to harmonize house price data for the whole of the European Union, for some time, but are only now beginning to publish (incomplete) indices.
The CoreLogic Home Price Index in the United States of America, introduced in 2008, is a repeat sales index which tracks increases and decreases in sales prices for the same homes over time, including single-family attached and single-family detached homes.
The CoreLogic HPI provides a multi-tier market evaluation of repeat sales transactions based on price, time between sales, property type, loan type (conforming versus non-conforming) and distressed sales. Released once a month, the CoreLogic HPI has a lag time of roughly two months.
The US Standard & Poor‘s Case-Shiller index measures prices monthly and tracks repeat sales of single family homes using a modified version of the weighted-repeat sales methodology proposed by Karl Case and Robert Shiller (Fig -1-). The US housing market through Case-Shiller Index gave an advanced downtrend indication from the 4th quarter of 2005 to the US mortgage crisis in Sep 2008.

Fig-1 Case-Shiller Index
House price indices have been produced in the UK since 1973, initially by mortgage providers and, more recently, by government bodies. Some of the price observations used include: actual price paid, price at mortgage completion, value for mortgage loan approval, rental prices, and asking prices. The Financial Times newspaper launched a monthly HPI calculated by Acadametrics, using Land Registry source data based on the actual prices paid.
In Canada, the New Housing Price Index (NHPI) is a monthly series that measures changes over time in the contractors' selling prices of new residential houses, where detailed specifications pertaining to each house remain the same between two consecutive periods.
Hayek Group/Acadata HPI for Lebanon
Knowing that the Lebanese housing market has a problem with the spread and sufficiency of data, Hayek Group steered an extensive research analysis on the data delivered by the real estate directorate, The Order of Engineers & Architects, housing loan providers, cement factories and many other private and public data sources. The target from this research is to customize a local Lebanese (Hayek Group/Acadata) House Price Index. Dr. Peter Williams, Director Cambridge Center for Housing and Planning Research (CCHPR) quotes: “In terms of an up to the minute measure of where the market is, asking prices are the most useful index”
“Our own LSL Acad HPI is not an indicator of market sentiment which is best provided by an Asking Price Index” wrote Mr. David Thorpe, Managing Director of Acadametrics Ltd.
Preparation of an Asking Price Index was our decision. Why would an engineering and property development firm in Beirut issue a periodical HPI? What if the data were biased? The answer is simple. The data provided are the actual asking prices for middle income housing units mostly below 300m2 in Beirut and Mount Lebanon; this size is equivalent to an average 80% of the total built up units and almost 75% of the construction areas in Lebanon. The data are taken within the period 2003 to 2013 and from Jan 2012 to Feb 2013. Such data are provided by owners, including all supporting documents, and the analysis were conducted by Acadametrics, a UK based analytics and research consultancy firm focused on house prices and property portfolio risk. Although asking prices are subject to negotiation until the final sale prices are agreed, developers are wise enough to provide reasonable asking prices within an acceptable margin.
1- Beirut Residential Property Asking Prices Q1 2003 - Q1 2013
The graph in Fig-2 shows the asking prices of the Hayek Group clients for residential properties in Beirut (excluding BCD) over the ten year period Q1 2003 – Q1 2013, expressed in US dollars. We have also included a trend line over this period to indicate the underlying trend in the movement of average prices over the ten years. This represents a near fivefold increase in average residential prices, expressed in US dollars, over the ten year period. Since Q2 2012, average prices in Beirut have fallen below the ten year trend. This reflects the current weakness in the market of large units probably arising from the lack of consumer confidence, in turn, most probably caused by the political turmoil in the region.
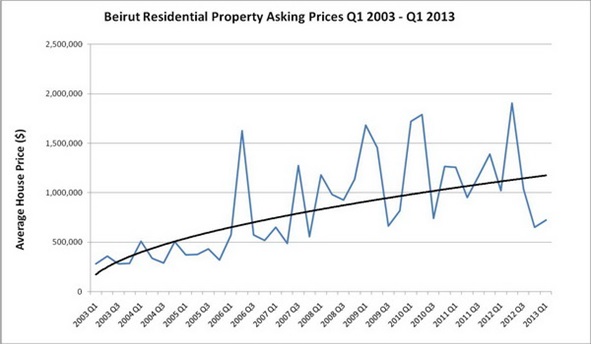
Source: Hayek Group data for the Hayek Acad House Price Report
Fig-2
2- Mount Lebanon Lot Asking Prices 2003 - 2013
The graph in Fig-3 shows the asking prices per square meter of the Hayek Group Clients for building lots in the Mount Lebanon area over the ten year period Q1 2003 – Q1 2013, expressed in US dollars. We have also included a trendline over this period to indicate the underlying trend in the movement of these average prices over the ten years. As can be seen, the price paid per square meter for a lot in the Mount Lebanon area has an upward trend. Since Q4 2011 the price paid per square meter has been above trend, particularly so in Q2 2012 and in the current period Q1 2013. This may suggest that property developers believe that the current weakness in the residential property market will be a short term phenomenon.
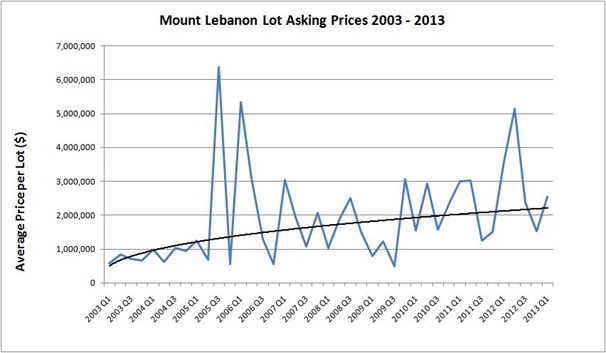
Source: Hayek Group data for the Hayek Acad House Price Report
Fig-3
3- Mount Lebanon Residential Property Asking Prices Jan 2012 - Feb 2013
The graph in Fig-4 shows the asking prices of the Hayek Group clients for residential properties in the Mount Lebanon area on a monthly basis from January 2012 to February 2013, expressed in US dollars. We have also included a trendline over this period to indicate the underlying trend in the movement of average prices over the year. The average price in February 2013 is on trend, albeit this is showing a fall of 20% in property prices over the last thirteen months.
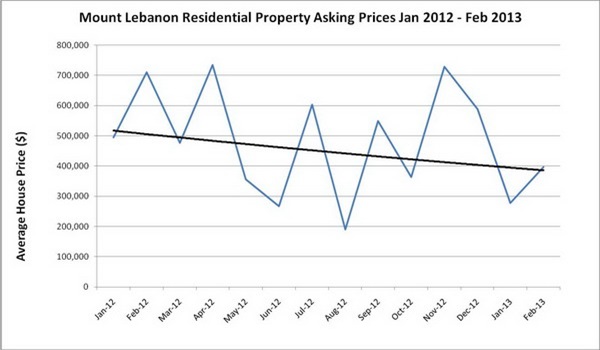 Source: Hayek Group data for the Hayek Acad House Price Report Source: Hayek Group data for the Hayek Acad House Price Report
Fig-4
4- Mount Lebanon Residential Asking Prices Q1 2003 – Q1 2013
The graph in Fig-5 shows the asking prices per square meter of the Hayek Group clients for building lots in the Mount Lebanon area over the ten year period Q1 2003 – Q1 2013, expressed in US dollars. We have also included a trendline over this period in order to indicate the underlying trend and the movement of these average prices over the ten years. Since Q4 2011, the price paid per square meter has been above trend, particularly so in Q2 2012 and in the current period Q1 2013. This may suggest that property developers believe that the current weakness in the residential property market is still within an acceptable range compared to the regional financial disorder in EU countries and particularly in neighboring Cyprus.
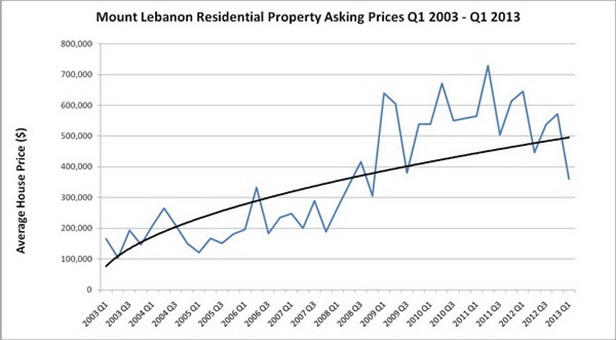
Source: Hayek Group data for the Hayek-Acad House Price Report
Fig-5
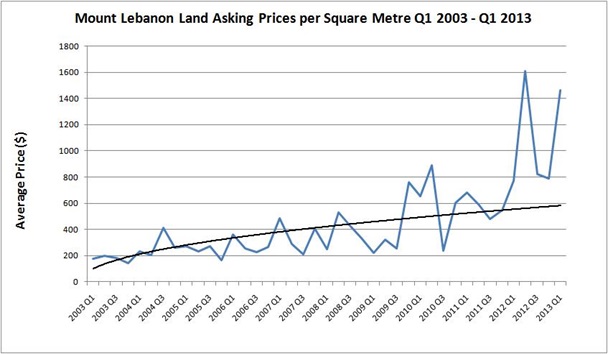
5- Mount Lebanon Land Asking Prices per Square Meter Q1 2003 - Q1 2013
The graph in Fig-6 shows the asking prices per square meter of the Hayek Group Clients for building lots in the Mount Lebanon area over the ten year period Q1 2003 – Q1 2013, expressed in US dollars. We have also included a trendline over this period to indicate the underlying trend in the movement of these average prices over the ten years. Since Q4 2011 the price paid per square meter has been above trend, particularly so in Q2 2012 and the current period Q1 2013. This may suggest that property developers believe that the current weakness in the residential property market will be a short term phenomenon.
Source: Hayek Group data for the Hayek-Acad House Price Report
Fig-6
Analyzing The Big Picture
This report covers the era of the past ten years only, from 2003 to 2013. Rich oil producing countries invested heavily in the real estate market in Lebanon, as a result of the sufficiency of funds and the lack of other business opportunities in the region. Property prices as shown in the graphs above were resilient to major tragic events including assassinations of prime political and public Lebanese figures, Israeli aggressions and global economic downturn on top of continuous political instability in the region; housing prices in Dubai plunged, the USA real estate crash crisis in Q4 of 2008 occurred and the EU countries suffered from the failure of states and major banks to fulfill their financial obligations. However, Lebanese securities were respected by major financial creditors throughout this period. Credit for such positive results should be given to the Lebanese Monitory Policy decision makers and the Lebanese Central Bank Governor, Mr. Riad Salameh.
Lebanese expatriates were the major economic contributors in the period mentioned above. While Gulf investments migrated to European and American markets, Lebanese expatriates invested heavily in the housing sector in Lebanon to provide middle income family units supported by local housing loan providers and by incentives to ease environmental and legal restrictions in the housing industry; these are why it is much easier to issue a construction permit in Lebanon than in most of other countries.
Housing prices did experience a decline in 2012-2013 as shown in Fig-4. This decline reflects the surplus of units available, or under construction units, the weakness in the purchasing power of buyers and the influence of the Syrian conflict on the Lebanese housing sector.
The resilience of the housing sector in Lebanon for the past 3 decades has no economic or academic justification; housing start-ups are expected to increase, along with a modest rise in small home prices in 2013 that is likely to peak in 2014. The Lebanese economy is now more likely to improve, propelling with it the housing industry, including real estate and property markets due to the promising on-going oil and gas exploration and the controlled political conflict accompanied by international support for the local government.
Vacancy rates for industrial and commercial properties are projected to decrease until the transit flow of products resumes through the Syrian territories. For all types of rental properties, rents are expected to increase depending on the proximity and the accessibility to the capital and main business districts. Although all indications suggest that economic growth will be steady rather than sporadic, there is always the chance of counter influences based on factors like the 2013 Lebanese parliamentary election, the European debt crisis, the Syrian conflict, and tightening financial regulations in both the US and EU countries.
To conclude, we would greatly value and consider any comments and recommendations regarding the Hayek-Acad HPI which will enable us to provide a new tool for the local market to help monitor and avoid any future crises in the Lebanese housing sector.
Hayek Group LLC: Is one of the leading engineering groups in Lebanon and a major player in property development, providing engineering, construction, and project financing services to the housing sector. Founded in 1951, HG has been active regionally. HG’s client reach includes local and expatriate Lebanese as well as regional and international clients. Http://www.hayekgroup.com
Acadametrics: Is an analytics and research consultancy which is particularly focused on house prices under the Acadata brand as well as on property portfolio risk. The mainstream house price index for England & Wales was launched in 2003 by the Financial Times and now published as LSL Acad E&W HPI, following a 2010 sponsorship offer by LSL Property Services PLC. Risk solutions provided by the top flight consultancy MIAC Acadametrics Ltd, jointly owned with New York based MIAC Analytics, employ world class econometrics from Dr Stephen Satchell, Economics Fellow, Trinity College, University of Cambridge, previously “The Reader in Financial Econometrics” at the Depart met of Economics. The LSL Acad Scotland HPI employs transacted prices from the Registers of Scotland. The Acadametrics Prices and Transactions (APAT) data provide monthly average prices and sales volumes used for collateral valuations by mortgage lenders. Acadametrics is delighted to be undertaking the regular preparation of the Hayek Group Acadata in Lebanon’s HPI and to be co-operating with the Hayek Group. David Thorpe Managing Director writes "We believe that provision of this HPI will be a very important step forward and one of great value for the housing sector in Lebanon, for the authorities and for many institutions and organizations working in or affected by the housing market. We will support Hayek Group in every way possible and look forward to applying our academic and research skills and to working with Hayek Group on risk and other problems." Http://www.acadametrics.co.uk
Abdallah Hayek P. E
CEO
Hayek Group s.a.r.l
Beirut - April 2013
|